June 29, 2026
Gold Technical Analysis Report - 29 Jun 2026: Dubai Retail Buyers Eye Key Support Levels as Spot Prices Correct
The global precious metals market has reached a critical juncture as June draws to a close. After experiencing a volatile month marked by shifting macroeconomic data and changing expectations around international monetary policy, spot gold (XAU/USD) is hovering near significant psychological and technical baselines.
For physical buyers, institutional investors, and retail traders checking the Dubai gold rate today, the final week of June has carved out a compelling technical setup. This comprehensive technical report breaks down the immediate price action, chart patterns, support and resistance structures, and key indicators shaping the gold outlook.
Technical Overview: The June Correction Pattern
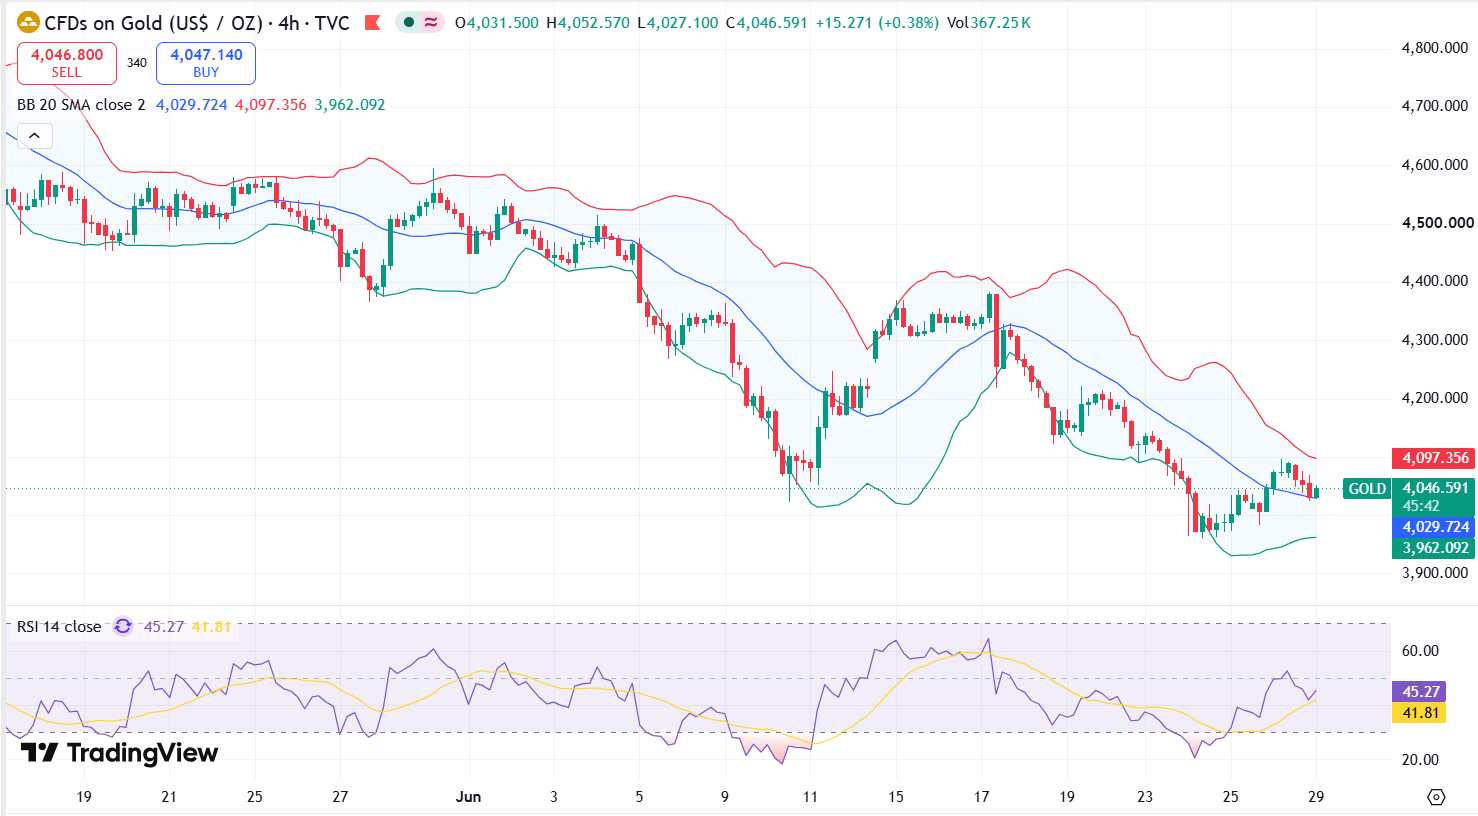
Throughout June 2026, spot gold faced persistent selling pressure that pulled prices back from earlier historical highs. The commodity recently hit a multi-month low near $4,022 - $4,024 per ounce before generating a minor relief bounce.
On the daily charts, the primary narrative remains a medium-term corrective phase. Gold has pulled below its 50-day Simple Moving Average (SMA) and its 200-day SMA, signaling that bears currently command short-to-medium-term momentum. However, long-term structural demand indicators suggest the market is entering a deep value accumulation zone.
| Overhead Resistance | $4,150 - $4,200 |
| Correction Relief Target | |
| LIVE SPOT GOLD PRICE | $4,040 - $4,075 |
| Strong Value Floor | |
| Major Support Zone | $3,980 - $4,000 |
Key Technical Indicators At A Glance
- Relative Strength Index (RSI): The 14-day RSI is currently hovering near 40, recovering slightly from near-oversold territory. This leaves room for minor upward consolidation before any sustained breakdown.
- MACD (Moving Average Convergence Divergence): The MACD line remains pinned below the signal line in negative territory. However, the histogram histograms are beginning to contract, pointing toward a deceleration in selling momentum.
- Moving Averages: The 50-day SMA sits significantly above current prices near $4,530, while the 200-day SMA is located around $4,466, establishing a major structural recovery target for eventual bulls.
Spot Gold Price Analysis: Crucial Support and Resistance Levels
To successfully navigate the XAU/USD trading pairs today, market participants must monitor specific horizontal price layers and psychological boundaries.
- Immediate and Major Support Levels
- S1 ($4,022 - $4,024): This region marks the exact multi-month low established last week. It represents an immediate structural floor.
- S2 ($3,980 - $4,000): The $4,000 psychological benchmark is the ultimate battleground for bulls. Technical charts show major historical buyer defense here. If gold breaks below this level, a deeper slide toward Target Zone 4 ($3,857) could open up.
- Immediate and Major Resistance Levels
- R1 ($4,100 - $4,120): A minor cluster area where short-term counter-trend rallies ran out of steam earlier in the week.
- R2 ($4,180 - $4,203): This marks a major overhead resistance block (Resistance A). A daily candlestick close above $4,203 is required to invalidate the immediate bearish bias and trigger a short squeeze toward $4,340.
Retail Visual: Dubai Gold Market Impact
The international spot price correction has directly influenced retail pricing in the Dubai Gold Souk and retail outlets across the UAE. Because Dubai pricing operates on a transparent calculation directly tethered to global spot prices and USD/AED pegs, retail buyers are enjoying some of the most competitive prices seen in the last six months.
| Gold Purity (Karat) | Retail Price Per Gram (AED) | Shift from June Peak (Per Gram) |
|---|---|---|
| 24K Gold | AED 488.00 | Down ~AED 54.50 |
| 22K Gold | AED 451.75 | Down ~AED 50.50 |
| 21K Gold | AED 433.25 | Down ~AED 49.25 |
| 18K Gold | AED 371.25 | Down ~AED 42.25 |
Market Note: The sharp correction from the June 2 peak—where 24K traded at AED 542.50 and 22K reached over AED 502.25—has renewed massive retail interest. Physical jewelry and bullion buyers who stayed on the sidelines during the early June rally are utilizing this correction as a strategic entry window.
Macroeconomic Catalysts Fueling the Technical Charts
Technical patterns rarely form in a vacuum. The structural pullback observed on June 29, 2026, is driven by clear macroeconomic fundamentals that have altered near-term yields.
- The Federal Reserve Policy and Real Yields
The core driver behind gold's 25% drop from its January all-time high ($5,589) is the persistence of higher real yields. Despite headline US CPI inflation sitting elevated at 4.2% due to energy fluctuations, Core CPI managed to ease down to 2.9%.
This economic resilience has caused institutional desks to strip expectations of early Federal Reserve interest rate cuts out of their models, adding structural tailwinds to the US Dollar Index (DXY) and forcing capital out of non-yielding assets like spot gold.
- The Structural Floor: Central Bank Accumulation
While the technical chart looks bearish on a short-term horizon, institutional year-end targets from global banking giants remain intensely bullish:
- Goldman Sachs: Maintains a firm year-end target of $4,900/oz.
- JPMorgan: Projects a re-acceleration back to $6,000/oz in late 2026.
- UBS: Targets $5,900/oz by December.
The underlying reason these mega-institutions refuse to abandon their bullish forecasts is structural sovereign buying. Central banks purchased 244 net tonnes of gold in Q1 2026, creating an invisible, resilient institutional price floor just below current levels.
Trading Strategy and Outlook for Gold Trade Dubai
For retail traders and bullion investors executing orders through Gold Trade Dubai, the technical outlook suggests a two-pronged tactical approach based on individual risk horizons.
Short-Term Tactical Approach (Day Traders)
Momentum strategies favor selling on rallies until a structural bottom is confirmed. Look for short opportunities if the price bounces into the $4,150 - $4,180 resistance zone, setting an immediate target back down at $4,050 with tight stop-losses placed just above $4,205. Alternatively, aggressive intraday long positions can be scalped if a clear double-bottom pattern forms near the $4,022 support layer.
Long-Term Value Accumulation (Bullion Buyers)
For long-term physical gold asset managers, the current price structure presents a textbook "buy-the-dip" setup. Accumulating physical bars or coins within the AED 480 - AED 490 range for 24K gold offers a strong safety margin. The asset is approaching major historic daily support curves (such as the SMA200 zone) which historically precede multi-month structural rallies.
Conclusion: Will the Psychological Floor Hold?
As the session progresses on 29 Jun 2026, the key metric to observe will be gold’s ability to defend the $4,022 zone on a daily closing basis. If the bulls successfully absorb the selling pressure at this tier, an extended upward correction toward the $4,180 resistance band remains highly probable over the coming days. Conversely, a definitive break below the $4,000 barrier will shift the technical spotlight down to the next structural target zone near $3,879.
Stay tuned to Gold Trade for real-time live price tracking, daily technical analysis updates, and direct access to Dubai's premium bullion trading services.
« Back to News & Reports List