
September 01, 2026
Gold Technical Analysis Report - 01 Sept 2026: XAU/USD Navigates Volatility Near $4,368 as Market Weighs Fed Policy and Safe-Haven Demand
Dubai, UAE — September 01, 2026 — Spot gold (XAU/USD) demonstrated heightened intraday price volatility during Tuesday's trading session, establishing a wide price corridor between a daily low of $4,326.17 and a high of $4,461.53 per troy ounce. As of late trading hours, spot gold is consolidating near the $4,368.00 level, absorbing an intraday pullback of nearly $81 from its session peak.
This rapid price action highlights an ongoing tug-of-war between short-term institutional profit-taking and resilient underlying safe-haven accumulation. For bullion traders, retail investors, and institutional portfolio managers operating within the Dubai precious metals market—a globally recognized hub for physical gold flow—navigating both technical chart formations and macroeconomic catalysts is essential for positioning entering the final quarter of 2026.
This comprehensive technical and fundamental report prepared by Gold Trade breaks down current price structures, momentum indicators, structural support/resistance zones, and market drivers shaping the future trajectory of gold.
Intraday Price Action & Market Structure
The trading session opened with strong momentum, carrying XAU/USD through initial overhead pivot levels to hit a high of $4,461.53. However, the surge encountered immediate supply defense near overhead psychological resistance, prompting rapid position trimming by short-term market participants. The subsequent retracement dragged prices down to test dynamic intraday liquidity at $4,326.17 before dip-buyers re-entered the market.
The resulting price spectrum establishes key operational boundaries for the short-term horizon:
- Session High ($4,461.53): Represents the primary overhead resistance level. A clear breakout and daily close above this marker confirm structural continuation toward the $4,500.00 milestone.
- Equilibrium Zone ($4,380.00 – $4,410.00): The current trading area around $4,380.00 reflects fair market value on the 1-hour timeframe, serving as a consolidation base for institutional order accumulation.
- Session Low ($4,326.17): Serves as immediate demand defense. Holding above this structural trough maintains the short-term bullish bias.
Technical Chart Analysis & Momentum Indicators
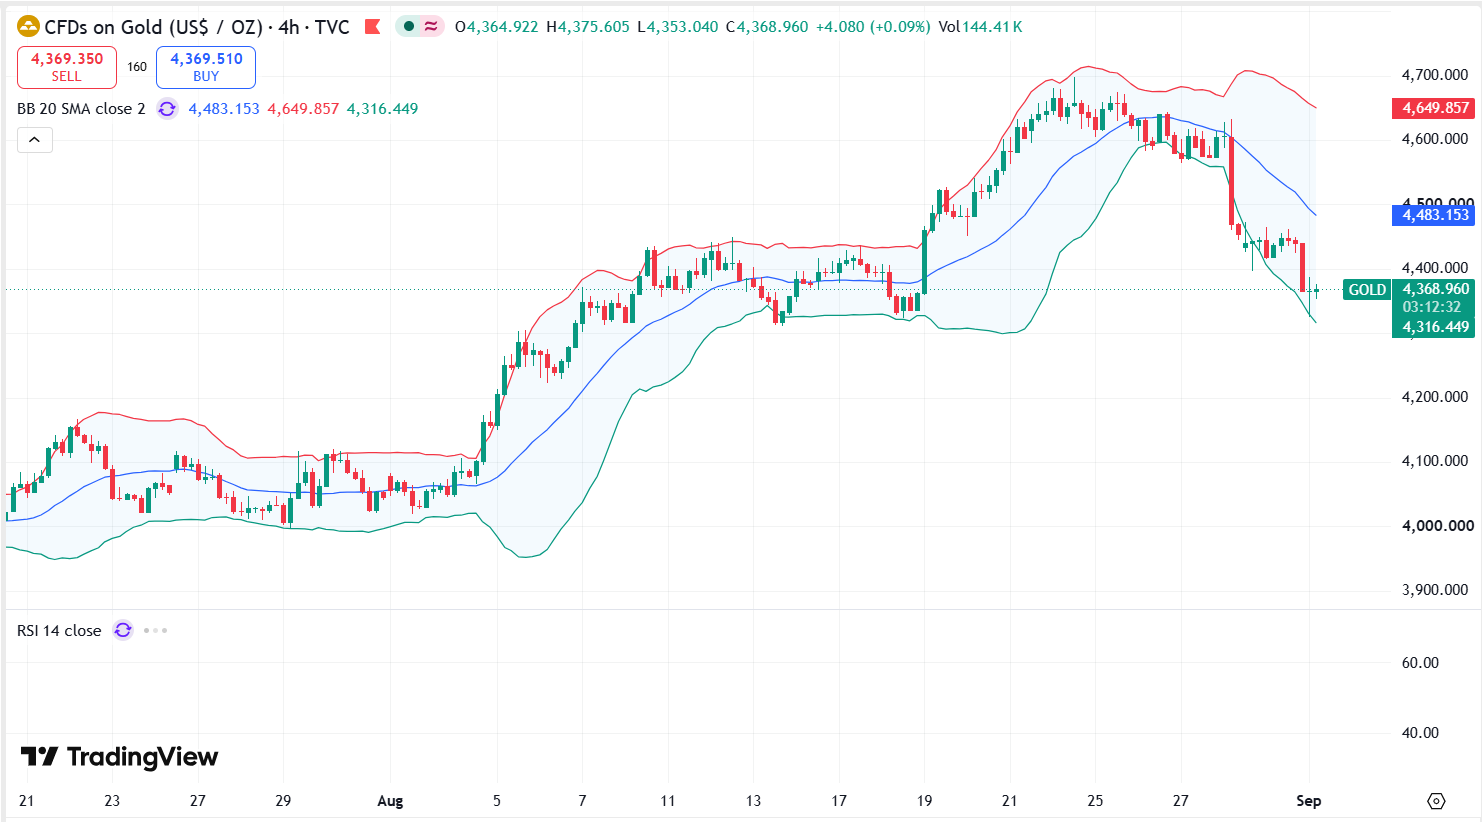
A multi-timeframe chart evaluation reveals that despite the sharp pull from session highs, gold's higher-degree macro structure remains constructively bullish.
Exponential Moving Averages (EMAs)
On the 4-hour chart, XAU/USD continues to trade above critical trend-defining moving averages:
- 20-period EMA ($4,395.20): Acts as immediate dynamic resistance on shorter timeframes.
- 50-period EMA ($4,368.50): Aligns closely with today's low ($4,326.17), forming a strong confluence support zone.
- 200-period EMA ($4,285.00): Represents the primary structural floor for macro trend integrity. As long as price remains above $4,285.00, the macro bull market stays intact.
Momentum Oscillators: RSI and MACD
- Relative Strength Index (RSI 14): The daily 14-period RSI pushed into overbought territory near 74.00 during the morning rally before cooling to 52.40 following the pullback to $4,368.00. This reset removes short-term overbought exhaustion without dropping into bearish territory, offering bulls technical headroom for a renewed push upward.
- Moving Average Convergence Divergence (MACD): While short-term 15-minute timeframes show a minor bearish crossover, the daily MACD histogram remains firmly above the zero signal line, confirming dominant upward momentum across medium and long-term horizons.
Fibonacci Retracement Confluence
Mapping Fibonacci retracement levels across the recent leg from recent swing lows to today's peak identifies critical technical pivot zones:
- 23.6% Retracement ($4,412.80): First resistance hurdle to reclaim.
- 38.2% Retracement ($4,375.40): Intersects directly near current spot prices ($4,368.00), acting as active structural demand support.
- 50.0% Equilibrium Level ($4,345.10): Secondary defense zone for swing buyers.
- 61.8% Golden Ratio ($4,314.80): Key institutional accumulation floor.
Fundamental Analysis: Core Drivers Impacting Future Gold Prices
Technical levels dictate entry and exit points, but global macroeconomic drivers ultimately govern long-term market direction.
Federal Reserve Policy & Interest Rate Sentiment
Market anticipation regarding US Federal Reserve monetary policy remains the dominant macro price driver. Shifts in rate-cut expectations directly influence gold yields:
- Lower Real Yields: Non-yielding assets like physical gold gain strong investment appeal as interest rates fall, reducing the opportunity cost of holding bullion.
- Rate Volatility: Any hawkish monetary stance boosts Treasury yields, temporarily placing price ceilings on XAU/USD rallies.
US Dollar Index (DXY) Inverse Correlation
Spot gold maintains a strong inverse relationship with the US Dollar Index. Recent fluctuations in the DXY prompted short-term liquidations across commodities. However, persistent global currency volatility continues to direct institutional liquidity toward precious metals as a secure store of value.
Central Bank Purchasing & Dubai Market Resilience
Central bank diversification away from fiat paper assets into gold reserves continues at record paces in 2026.
- Dubai Trade Hub Advantage: As a premier global trading hub, Dubai's DMCC (Dubai Multi Commodities Centre) and the Dubai Gold Souk continue to report strong physical bullion flows.
- Retail & Investment Demand in UAE: Retail 24K and 22K gold prices across Dubai remain elevated, demonstrating robust regional demand from both consumers and private wealth investors despite international price fluctuations.
Key Support and Resistance Technical Matrix
To assist clients of Gold Trade in executing risk-managed trading strategies, below is the key decision matrix for XAU/USD:
Level Category Price (USD) Technical Significance Recommended Action Resistance 3 (R3) $4,500.00 Major Psychological Threshold & Target Target zone for macro breakout extension Resistance 2 (R2) $4,461.53 Today's Session High / Supply Zone Breakout target; confirmation of bull continuation Resistance 1 (R1) $4,412.00 23.6% Fibonacci / 20-period EMA Short-term intraday recovery level to reclaim Current Spot $4,368.00 Consolidation Equilibrium / 38.2% Fib Neutral base; monitor directional breakouts Support 1 (S1) $4,326.17 Today's Low / 50-period EMA Primary buy-on-dip defense zone Support 2 (S2) $4,315.00 61.8% Golden Ratio Retracement Major institutional accumulation floor Support 3 (S3) $4,285.00 200-period EMA Macro Floor Crucial long-term bull trendline support Strategic Outlook & Market Scenarios for Gold Trade Dubai Clients
Synthesizing technical signals and macroeconomic trends, Gold Trade presents two primary scenarios for the upcoming trading sessions:
Primary Bullish Scenario (65% Probability)
If spot gold maintains structural defense above today's low of $4,326.17 and breaks back above $4,412.00, buying volume will likely propel XAU/USD toward a retest of today's high at $4,461.53. A successful daily close above $4,461.53 opens the door for an expansion rally toward the major psychological level of $4,500.00.
Secondary Bearish Correction Scenario (35% Probability)
Should dollar strength or rate anxieties push prices below the immediate support of $4,326.17, gold may experience a controlled technical correction down to the 61.8% Fibonacci zone around $4,315.00. Institutional buyers view this potential pullback as an advantageous accumulation zone to rebuild long positions prior to Q4 seasonal strength.
Summary & Actionable Recommendations
The retracement from today's high of $4,461.53 to $4,368.00 represents a natural technical consolidation within a broader macro uptrend. Underpinned by persistent central bank demand, geopolitical hedging, and high physical turnover across Dubai's gold trading infrastructure, gold continues to serve as an indispensable portfolio stabilizer.
For personalized physical gold buying, institutional bullion hedging, and live price updates, contact Gold Trade today.
Disclaimer: The information provided in this Gold Technical Analysis Report is for educational purposes only and does not constitute financial advice. Trading gold and precious metals involves significant risk. Investors should conduct their own research or consult with a professional financial advisor before making any investment decisions.
« Back to News & Reports List